Manufacturing Quality Anomaly Detection Dashboard
Built and deployed a manufacturing-quality analytics dashboard that surfaced a 20-day yield excursion, D042 defect-share movement of +26.72 percentage points, EQP_07 failure-event-share movement of +26.32 percentage points, and the most unusual multi-signal daily patterns across a 90-day analysis window.
Overview
Built and deployed an interactive manufacturing-quality dashboard covering a 90-day analysis window with 3,240 source quality rows, 19,635 capped defect-event records, three corrective-action records, and 90 daily aggregates across product, stage, line, equipment, station, lot, and shift dimensions.
The workflow combines an interpretable baseline-derived yield reference, trailing trend rules, defect-code and equipment concentration analysis, elevated retest-pass review, and unsupervised Isolation Forest ranking. Statistical signals explain why a day or entity deserves attention, while the model prioritizes multi-signal daily patterns for engineering review.
The analysis includes overlapping yield degradation, D042 concentration, and EQP_07 concentration with elevated retest-pass behavior, followed by a recovery phase. The workflow evaluates whether these signals are surfaced, but it does not determine root cause, establish real-world model accuracy, or prove causal corrective-action effects.
My contribution covered Python and NumPy data preparation, Polars transformation and feature engineering, statistical yield monitoring, defect and equipment concentration analysis, Isolation Forest ranking, corrective-action pre/post comparisons, ECharts dashboard engineering, automated tests, and Cloudflare Pages deployment.
Problem
Manufacturing-quality reviewers need to connect yield movement with defect concentration, equipment concentration, retest behavior, and action timing without relying on a single opaque anomaly score. Summary-only reporting can hide whether an excursion is broad, localized, transient, or accompanied by a possible screening-related signal.
Data Used
- Daily manufacturing-quality records covering 90 consecutive production days
- 3,240 source quality rows and 90 daily aggregates across product, process stage, line, equipment, station, lot, and shift dimensions
- 19,635 capped defect-event rows for defect-code and equipment concentration analysis
- Three corrective-action records across two action dates
- Overlapping yield, defect-concentration, equipment-concentration, and recovery periods
- Daily tested, failed, yield, retest-pass, defect-share, equipment-share, and rolling-trend signals
Review Scope
- The baseline and comparison windows are fixed so yield, concentration, anomaly-ranking, and corrective-action views use consistent review periods.
- The baseline-derived 3σ lower yield reference is an SPC-style monitoring aid, not a sample-size-adjusted p-chart.
- Isolation Forest is fitted on all 90 daily aggregates and used for prioritization; there is no held-out accuracy evaluation or production-data benchmark.
- Several features are correlated, including yield and fail rate, so the anomaly score is not independent evidence or a calibrated probability.
- Elevated retest-pass behavior is treated as a suspected false-fail signal for engineering review, not proof of false failure.
- Pre/post comparisons evaluate whether subsequent trends are consistent with improvement; they do not establish causal action effects.
Approach
Python and NumPy assemble the 90-day analysis dataset with 3,240 source quality rows, three overlapping abnormal-signal periods, and a subsequent recovery phase.
Polars transformations aggregate tested, failed, yield, retest-pass, defect-share, and equipment-share metrics into 90 daily rows and the comparison datasets used by the dashboard.
Interpretable statistical monitoring uses the first 45 daily aggregates, January 1 through February 14, as the yield baseline. The 98.7992% baseline mean and approximately 0.03829-percentage-point sample standard deviation produce a fixed 98.6843% lower reference at mean minus three standard deviations. No upper reference is calculated, and the limit is not adjusted for daily sample size, so it is an SPC-style baseline-derived 3σ lower yield reference rather than a formal binomial p-chart. A trailing seven-day mean requires all seven periods; the workflow flags daily yield below the lower reference or a trailing rolling-yield delta below -1.5 percentage points.
Concentration analysis compares capped defect-event rows and equipment failure-event rows between the January 1–February 15 baseline and February 16–March 7 comparison windows. It ranks D042 defect-event-share movement and EQP_07 failure-event-share movement, then adds a suspected false-fail review signal when retest-pass rate exceeds 50%. This evidence identifies patterns for investigation, not proven causes or false failures.
An unsupervised Isolation Forest with 200 trees, contamination 0.15, random_state 42, max_samples="auto", max_features=1.0, and bootstrap disabled is fitted across all 90 daily aggregates. Features, in model order, are yield rate, fail rate, retest-pass rate, trailing rolling-yield delta, top daily defect-code share, and top daily equipment failure share. The implementation applies no feature scaling or categorical encoding. The dashboard ranks the top 15 days by the negative score_samples value, where a higher displayed value means more anomalous; it does not present a validated anomaly classification. Yield and fail rate are exact complements, and several model features are correlated, so the ranking combines useful but non-independent signals.
Corrective-action review compares a 15-day pre-action window ending one day before each action with a 20-day post-action window beginning one day afterward. Three corrective-action records over two dates remain visible as context while yield, D042 share, and EQP_07 share are compared. The workflow does not attribute recovery causally to an individual action.
Investigation Focus
- The analysis dataset spans 90 days, 3,240 source quality rows, 19,635 capped defect-event rows, and 90 daily aggregates.
- The yield rules flagged all 20 days from February 16 through March 7, 2025.
- February 27 had the lowest daily yield at 95.62%, compared with the 98.68% baseline-derived lower reference.
- D042 defect-event share increased from 8.20% to 34.92%, a +26.72-percentage-point movement and the largest defect-code share increase.
- EQP_07 failure-event share increased from 12.92% to 39.25%, a +26.32-percentage-point suspicious concentration signal, not causal proof.
- The strongest daily suspected false-fail signal was a 69.30% retest-pass rate on February 27.
- Isolation Forest ranked February 27 first at 0.6968; all top 15 days fell inside the abnormal-pattern or recovery window.
- Three corrective-action records across two dates met the dashboard's pre/post improvement criteria; this does not establish causal effectiveness.
Key Investigation Choices
Keep analytical outputs reproducible.
A fixed Python and NumPy preparation pipeline keeps calculations, anomaly ranking, and chart behavior stable across builds while preserving confidentiality boundaries.
- Accept run-to-run variation in the analytical results
- Manually curate dashboard outputs
- Publish only static screenshots
Combine interpretable signals with ML ranking.
Baseline and concentration signals show why a day or entity is abnormal, while Isolation Forest prioritizes multi-signal days. The ML ranking supports engineering interpretation rather than replacing it.
- Use an opaque ML score only
- Build a static KPI dashboard only
- Rely on manual anomaly labeling
Use ranking rather than classification claims.
The project has no ground-truth label set, train/test split, or held-out evaluation. The dashboard therefore shows the top 15 days by anomaly score and makes no accuracy claim.
- Present the score as a calibrated probability
- Report accuracy without a validated label set
- Apply an arbitrary pass/fail class label
Extend the workflow through pre/post action review.
The dashboard follows the investigation beyond anomaly detection by checking whether post-action behavior is consistent with improvement, without asserting that an individual action caused the recovery.
- Stop at anomaly discovery
- Record actions without comparing subsequent outcomes
- Present pre/post recovery as causal validation
Methods & Tools
- Python 3.12
- Polars
- NumPy
- scikit-learn
- Isolation Forest
- JavaScript
- ECharts 5
- HTML/CSS
- pytest
- Ruff
- Cloudflare Pages
Result & Impact
- 90 daysQuality data scale
- 20 daysYield-signal window
- +26.72 pp / +26.32 ppConcentration movement
The workflow flagged all 20 dates in the yield-signal window from February 16 through March 7, 2025. The lowest-yield date, February 27, reached 95.62% against a 98.68% baseline-derived lower reference and was also the highest-ranked Isolation Forest day with a score of 0.6968. D042 increased from 8.20% to 34.92% of capped defect-event records, a +26.72-percentage-point movement. EQP_07 increased from 12.92% to 39.25% of failure-event records, a +26.32-percentage-point movement. These results surface concentration signals for review; they do not establish root cause. All top 15 ranked days fell within the abnormal-pattern or recovery window. Three corrective-action records met the dashboard's improvement criteria across 15-day pre-action and 20-day post-action windows. Because the actions overlap and there is no control group, the comparison does not establish causal corrective-action effectiveness.
Notes
- Interpretable yield and concentration signals make an unsupervised ranking easier for engineers to review.
- Fitting across the full 90-day window produces an unsupervised prioritization workflow, not a baseline-trained novelty detector or validated classifier.
- Correlated features such as yield and fail rate can reinforce the same condition, so anomaly scores should not be treated as independent evidence or probability.
- Elevated retest-pass behavior can support suspected false-fail review but does not prove that the original failures were false.
- Pre/post recovery patterns support workflow review but do not establish causal corrective-action effectiveness.
- A reproducible data-preparation pipeline keeps calculations and ranking behavior stable across builds.
Dashboard Experience
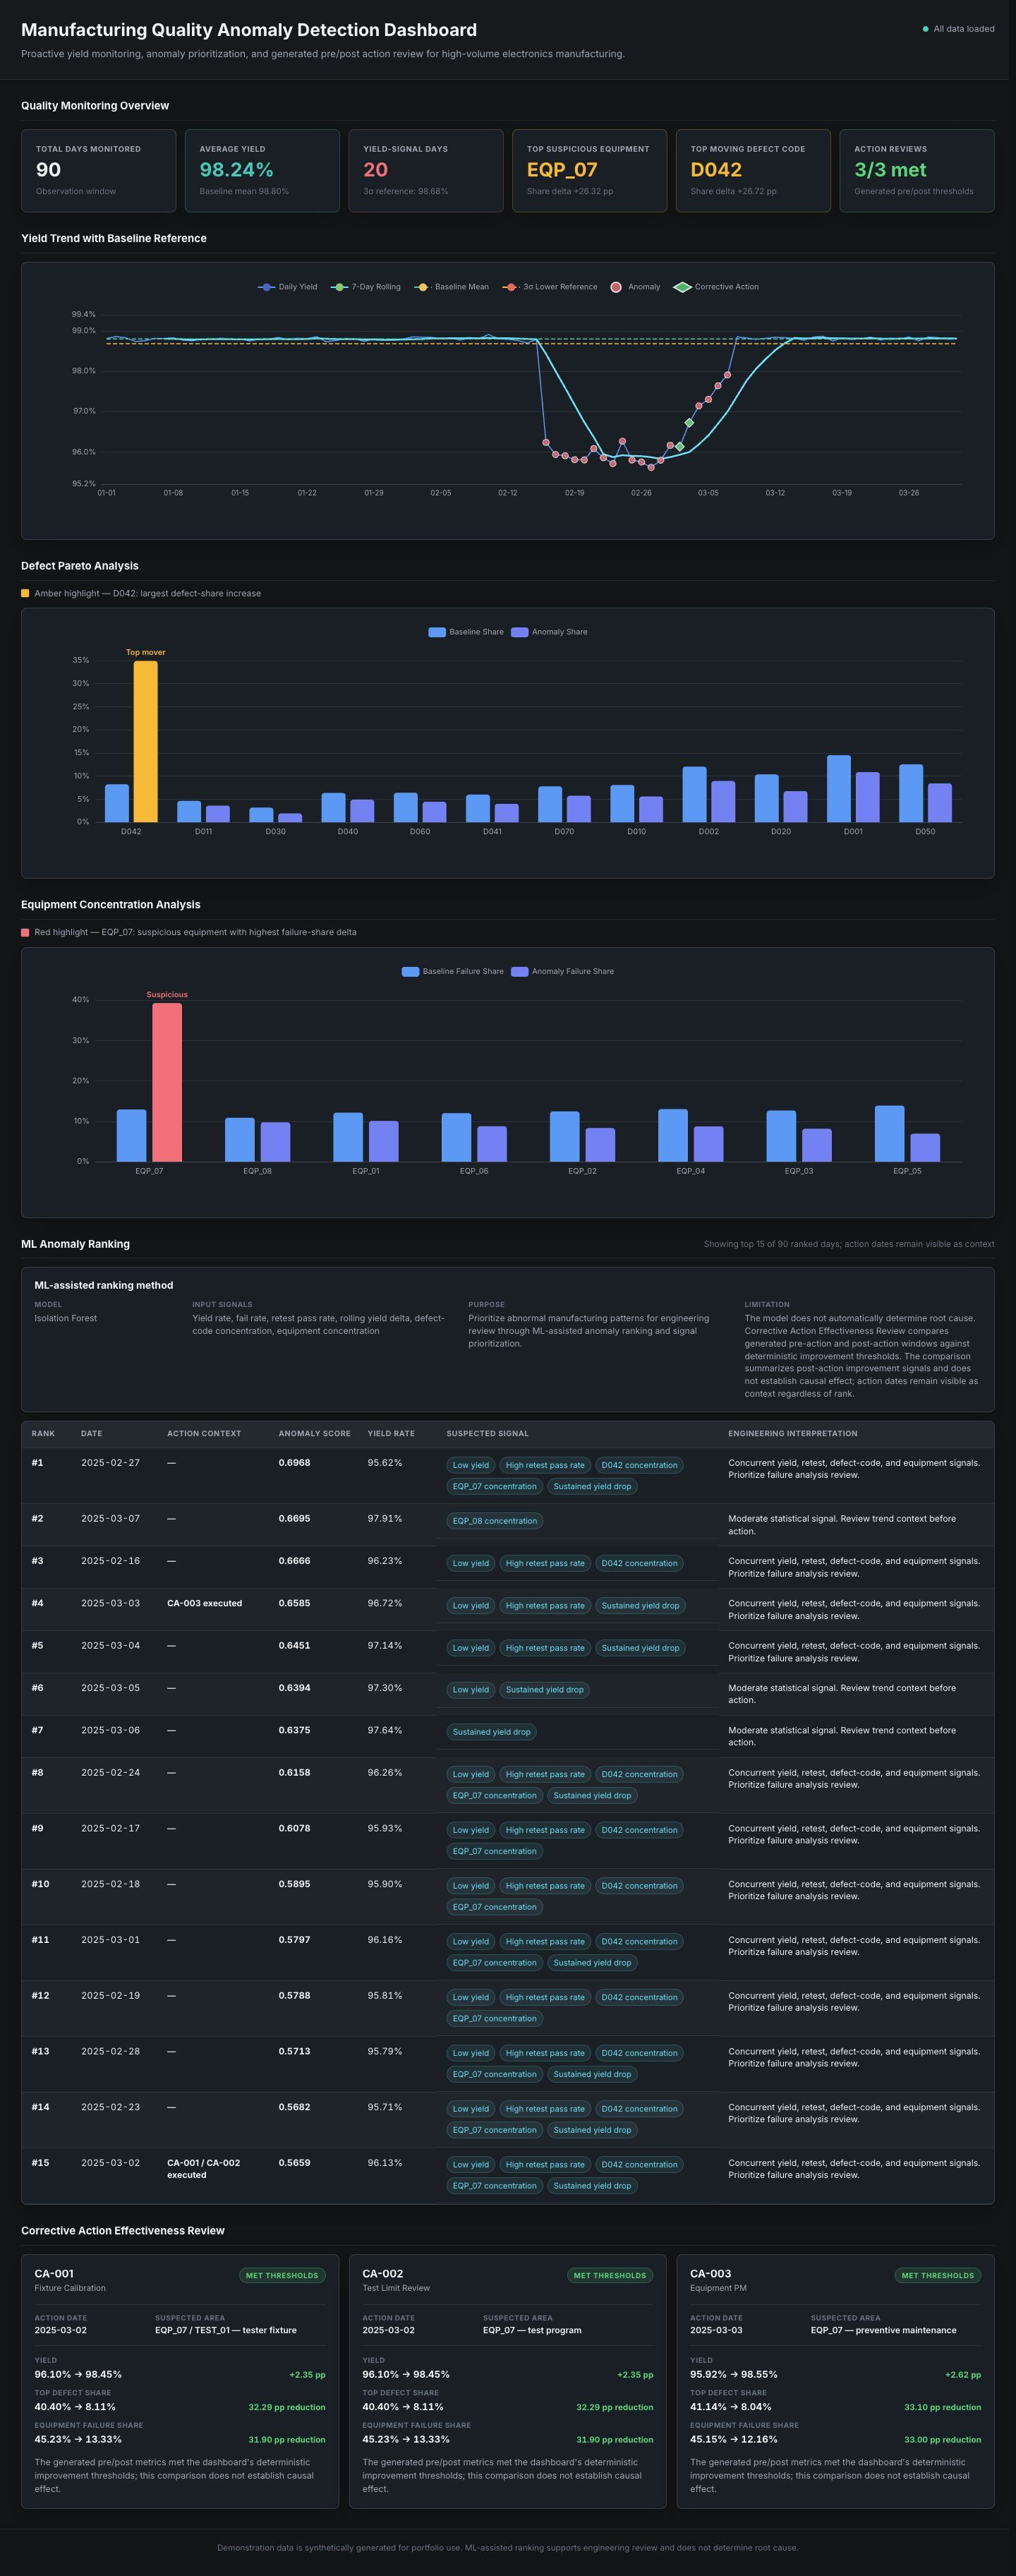
90-day manufacturing-quality review — 20 yield-signal days, D042 +26.72 pp, EQP_07 +26.32 pp, top-15 Isolation Forest prioritization, and three corrective-action records compared across pre/post windows.