Manufacturing Quality Tableau Dashboard
Built an interactive Tableau manufacturing-quality dashboard that connects yield trend, defect Pareto, equipment concentration, retest behavior, and corrective-action validation in one drill-down workflow.
Overview
Built an interactive Tableau dashboard for manufacturing-quality review, combining KPI overview, yield trend, defect Pareto, equipment concentration, retest behavior, and corrective-action validation in one analytical workflow.
The dashboard separates rapid signal review from engineering drill-down. The overview surfaces yield movement and dominant defect contributors, while the drill-down supports filtered analysis across product family, line, station, equipment, defect code, review period, and lot-level records.
My contribution covered dashboard information architecture, quality-metric definitions, data preparation, calculated analysis fields, filter and drill-down design, visual hierarchy, validation logic, and the supporting Python-to-CSV data pipeline.
Problem
Manufacturing-quality investigations require engineers to connect yield movement, defect contribution, equipment concentration, retest behavior, lot-level context, and corrective-action history. When these signals are reviewed in separate files or isolated charts, teams can identify that a metric moved without quickly determining where the issue concentrated or whether the response was effective.
The dashboard needed to support a practical investigation sequence: detect abnormal movement, prioritize defect contributors, inspect equipment and process concentration, assess possible false-fail behavior, and compare issue-period performance with the post-action validation window.
Data Used
- Daily manufacturing lot-level quality records
- Input, pass, fail, retest, and retest-pass quantities
- Product family, line, station, equipment, lot, and shift dimensions
- Defect codes and defect categories
- Baseline, issue, corrective-action, and validation-period markers
Review Scope
- Yield, defect PPM, retest-pass rate, and before/after comparisons must use consistent filter context and review-window definitions.
- Equipment concentration is an investigation signal and does not independently establish equipment causality.
- Elevated retest-pass behavior can indicate possible false-fail contribution, but it does not by itself exclude a repeatable product or process issue.
- Before/after corrective-action comparison documents association with recovery; it does not isolate the independent effect of every intervention.
Approach
Designed a two-level Tableau workflow: a Quality Overview for abnormal-signal detection and an Engineering Drill-Down for filtered investigation. The analysis connects KPI movement, time-series context, defect Pareto, equipment concentration, retest behavior, and before/after corrective-action validation across consistent review periods.
Investigation Focus
- Quality KPI overview
- Yield and defect-PPM trend analysis
- Defect Pareto prioritization
- Equipment concentration review
- Retest and retest-pass behavior
- Corrective-action before/after validation
Key Investigation Choices
Separate the quality overview from the engineering drill-down.
The overview supports rapid signal detection and prioritization, while the drill-down preserves the filters and detail required for equipment, defect, period, and lot-level investigation.
- Place every chart on one dense dashboard
- Build only an executive KPI overview
- Build only a detailed engineering worksheet
Combine trend, Pareto, concentration, and retest evidence.
No single view distinguishes a broad yield shift from a dominant defect, equipment concentration, or possible false-fail contribution. The combined workflow supports progressive investigation rather than isolated chart reading.
- Show only yield trend
- Show only defect Pareto
- Treat retest behavior as a standalone report
Define baseline, issue, corrective-action, and validation periods explicitly.
Consistent review windows make the before/after comparison interpretable and prevent filters from mixing the abnormal period with post-action monitoring.
- Compare arbitrary calendar ranges
- Show only the latest period
- Present corrective actions without outcome validation
Methods & Tools
- Tableau
- Python
- CSV
- Tableau Calculated Fields
- Dashboard Filters
Result & Impact
- 6 viewsAnalytical coverage
- 2 dashboardsDashboard experience
- Signal → validationReview workflow
Delivered an overview dashboard and engineering drill-down that connect abnormal-signal detection, defect prioritization, equipment concentration, retest analysis, and post-action validation in one Tableau workflow. The resulting dashboard supports a consistent progression from identifying what moved to investigating where it concentrated and reviewing whether the quality signal recovered.
Notes
- A useful quality dashboard should help teams move from abnormal-signal detection to action validation.
- Defect Pareto and equipment concentration views are stronger when paired with trend context.
- Retest behavior helps separate possible false-fail contribution from repeatable product-quality risk.
- A clear Tableau dashboard can help engineering and quality teams communicate the same manufacturing signal from different angles.
Dashboard Experience
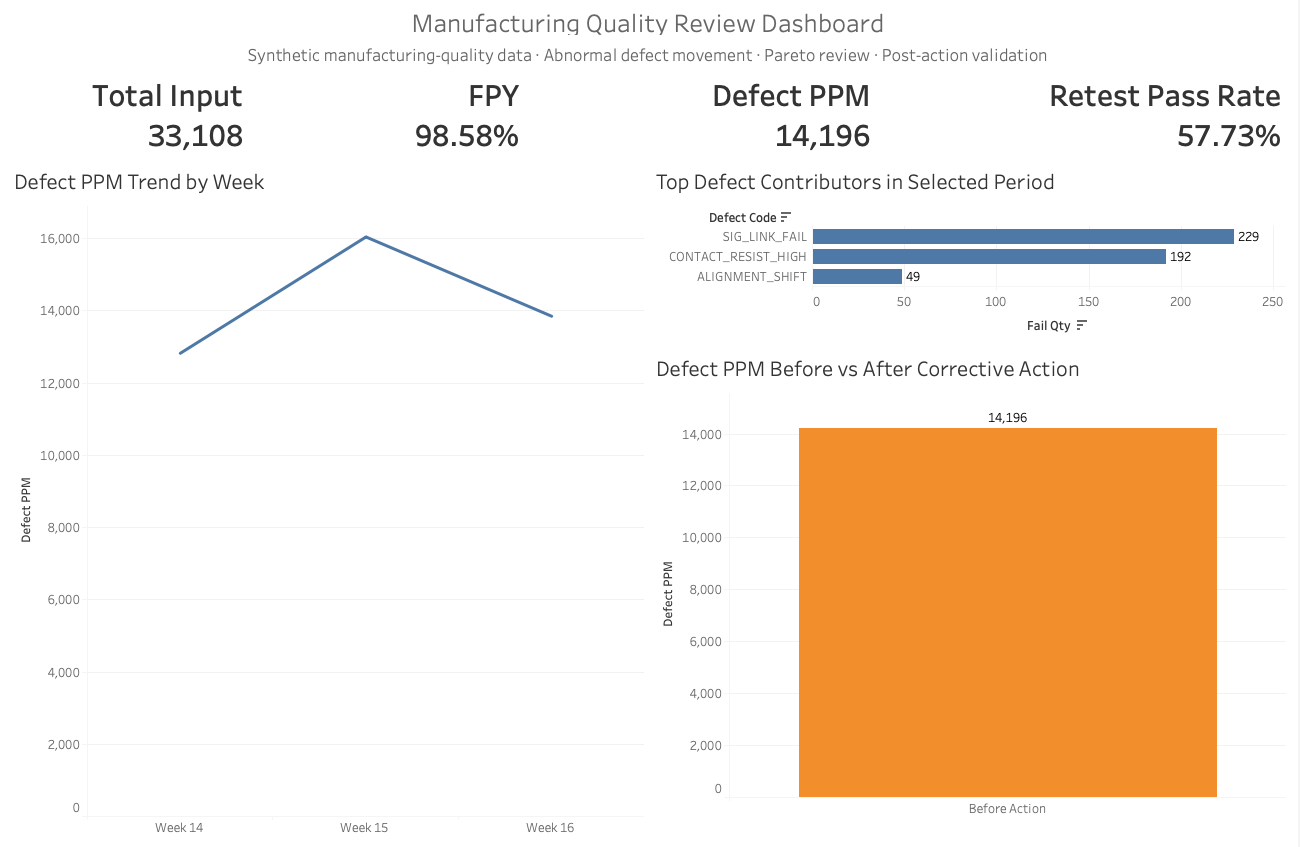
Quality Overview — combines KPI summary, defect-PPM trend, defect Pareto, and before/after corrective-action comparison.
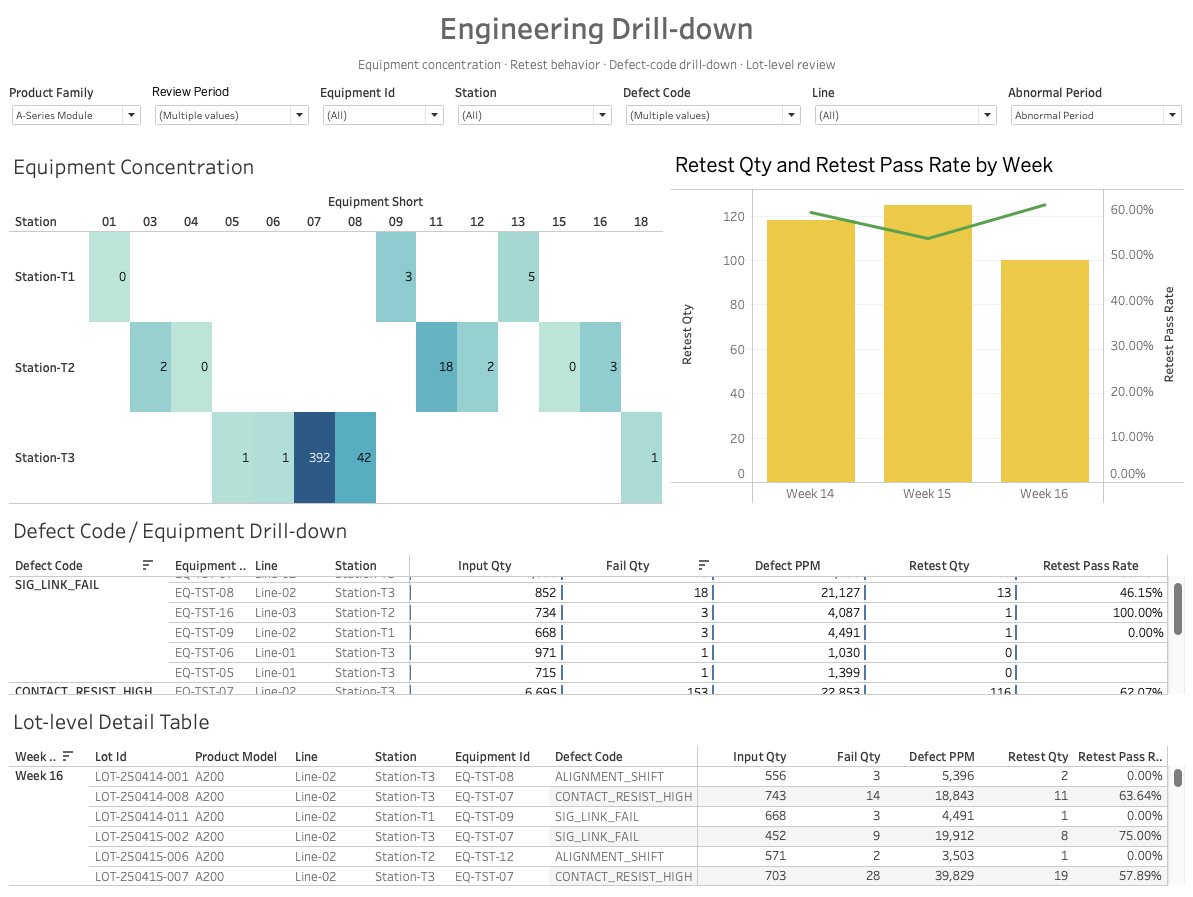
Engineering Drill-Down — supports filtered investigation by equipment, station, line, defect code, review period, and lot-level records.